
Table of Contents
- Why Your Neighborhood Matters More Than You Think: Clackamas County’s Micro-Markets
- Inside a Professional CMA: How Real Estate Agents Determine Your Home’s True Market Value
- Zillow’s Zestimate vs. Reality: What Automated Home Valuations Get Wrong
- Data Aggregation vs. Expert Interpretation: Why the Difference Matters to Your Bottom Line
- Price It Right or Pay the Price: The Financial Consequences of Mis-Pricing Your Home
- Final Thoughts
Imagine selling your home for $75,000 less than its true value—or watching it sit on the market for months because you priced it too high. In Clackamas County’s dynamic real estate market, your initial pricing decision can make or break your sale. With instant online estimates from Zillow and Redfin at our fingertips, you might wonder: why do 89% of successful sellers still work with real estate agents to price their homes?
The answer lies in the gap between automated convenience and local expertise. Clackamas County’s median home price of $631,300 represents a 5.2% year-over-year increase, with homes selling in an average of 42 days at 100% of asking price. In this competitive environment, getting your price right from day one isn’t just important—it’s everything.
This guide will demystify the pricing process by comparing professional Comparative Market Analysis (CMA) with Automated Valuation Models (AVMs), revealing why local expertise is irreplaceable. Drawing from Regional Multiple Listing Service data, Census Bureau statistics, and industry research from the National Association of Realtors, we’ll show you exactly how to position your home for maximum profit.
Why Your Neighborhood Matters More Than You Think: Clackamas County’s Micro-Markets
Clackamas County is not a single market but a collection of distinct communities with vastly different pricing dynamics. From affluent lakeside suburbs to historic urban centers and rural properties, each area has unique buyer expectations and price points that can vary by hundreds of thousands of dollars.
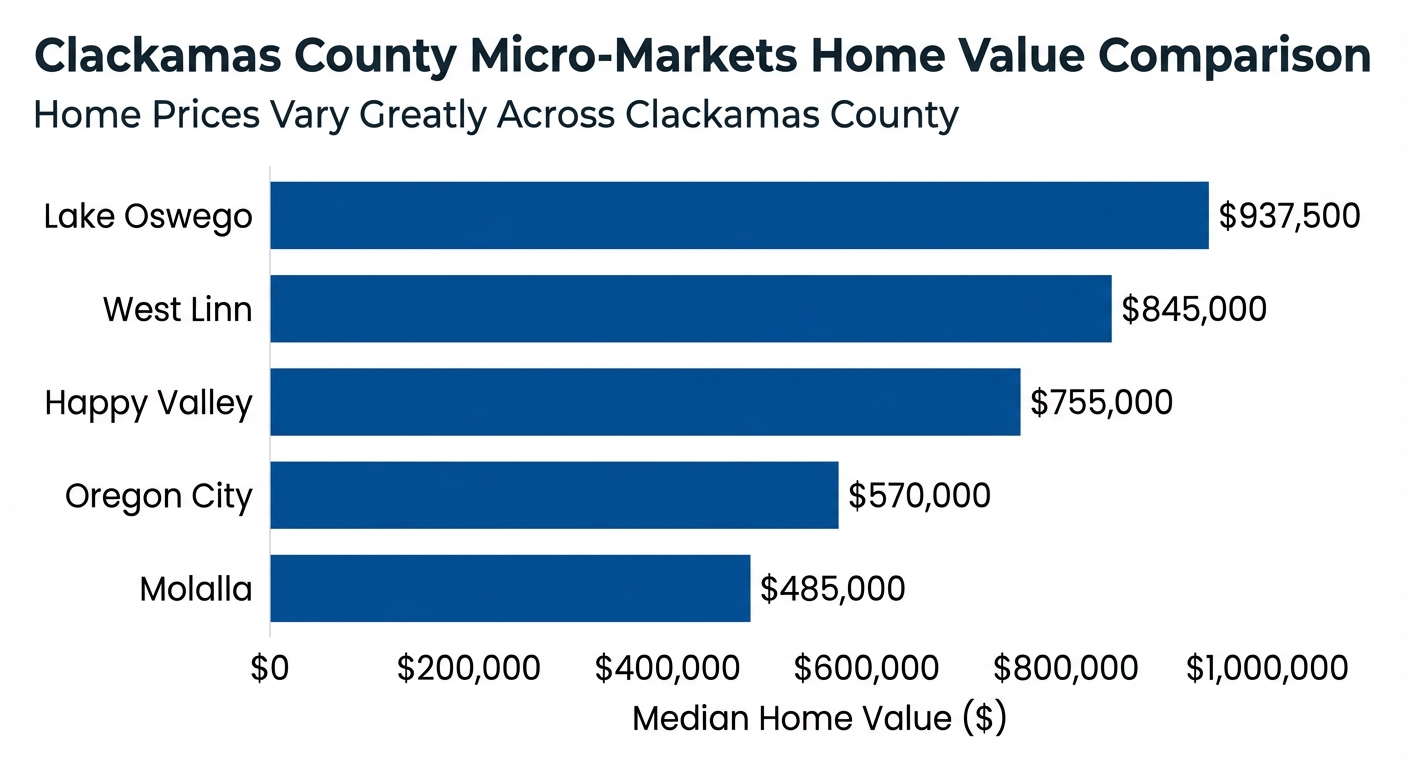
The chart above illustrates the dramatic price variations across our county’s cities. Lake Oswego leads with a median home value of $937,500, driven by its top-rated school district, lake access rights, and proximity to Portland. West Linn follows at $845,000, offering excellent schools, Mt. Hood views, and river access. Happy Valley’s newer construction and family-friendly suburbs command $755,000, while Oregon City’s historic downtown and diverse housing stock sits at $570,000. Rural Molalla, with its larger lots and affordability, has a median of $485,000.
The School District Premium
The Lake Oswego School District, consistently ranked among Oregon’s best, creates a tangible price premium that can add tens of thousands of dollars to a home’s value. This is just one example of the hyper-local factors that automated valuation tools often miss but that profoundly impact your home’s true market value.
Current Market Snapshot
Understanding where we stand today is crucial for pricing strategy:
- Median Sale Price: $631,300 (up 5.2% year-over-year)
- Average Days on Market: 42 days
- Inventory: 2.5 months (strong seller’s market)
- Sale-to-List Price Ratio: 100.0%
In this competitive environment where homes sell at asking price within six weeks, pricing accuracy from day one is absolutely critical. There’s no room for trial and error—the market won’t give you a second chance to make a first impression.
Inside a Professional CMA: How Real Estate Agents Determine Your Home’s True Market Value
A Comparative Market Analysis is the gold standard for home pricing—a comprehensive evaluative tool used by real estate professionals to determine a property’s current market value by analyzing similar recently sold properties. Unlike automated estimates, a CMA combines hard data with irreplaceable human insight.
The Selection Hierarchy for Comparables
Real estate professionals follow a rigorous process when selecting comparable properties:
1. Status Priority
- Sold properties are the foundation—these represent what buyers actually paid, not what sellers hoped to get
- Pending sales indicate current market momentum and buyer appetite
- Active listings show your competition and help position your pricing strategy
2. Proximity Matters
- Urban areas: Within blocks of your property
- Suburban areas: Same neighborhood or subdivision
- Rural areas: Within a few miles, accounting for larger geographic markets
3. Recency is Critical
- Preferably sold within the last 3-6 months
- In rapidly changing markets, emphasis on 90-day sales
- Older sales adjusted for market trends and shifts
4. Similarity in Key Features
- Size, age, condition, and style must align closely
- Differences are carefully adjusted for in the final analysis
The Art of Adjustments: Key Factors Analyzed
What separates a CMA from a simple price average is the sophisticated adjustment process that accounts for every meaningful difference:
Location Nuances
School district boundaries can create value differences of $50,000 or more between homes just blocks apart. A quiet cul-de-sac commands a premium over a busy arterial road. Proximity to parks, shopping, or commuter routes all factor into the equation. These hyper-local considerations require boots-on-the-ground knowledge that no algorithm can replicate.
Condition Assessment
A physical walkthrough reveals what no database can capture—fresh paint, meticulous maintenance, or deferred repairs. The difference between a home that shows “move-in ready” and one that needs work can translate to tens of thousands of dollars in buyer perception and actual value.
Updates and Renovations
Kitchen and bathroom remodels average over 90% return on investment in the Pacific region. A recently renovated kitchen with high-end finishes commands significantly more than one with 1990s cabinets and countertops—yet this critical difference often doesn’t appear in public records that AVMs rely upon.
Square Footage and Layout
It’s not just about total square feet—it’s about how that space functions. An open-concept floor plan commands a premium over a choppy, dated layout. A poorly configured space might require a negative adjustment even if the square footage matches comparable homes.
Lot Characteristics
A view of Mt. Hood, backing to green space, privacy from neighbors, or professional landscaping all add tangible value. These features create the lifestyle buyers are purchasing, not just the structure itself.
Market Climate Context
With only 2.5 months of inventory in Clackamas County, we’re in a strong seller’s market. A professional agent knows when to price aggressively versus conservatively based on current supply and demand dynamics.
CMA vs. Appraisal: Understanding the Difference
A CMA is a marketing tool designed to determine the optimal list price to achieve a sale. A formal appraisal, conducted by a licensed appraiser following Uniform Standards of Professional Appraisal Practice (USPAP), is a legally binding valuation required by lenders to ensure the property is adequate collateral for a loan. While both analyze comparable properties, a CMA focuses on what the market will pay right now to generate buyer interest and offers.
Zillow’s Zestimate vs. Reality: What Automated Home Valuations Get Wrong
Automated Valuation Models (AVMs) have revolutionized how homeowners think about their property’s value, offering instant, free estimates at the click of a button. Zillow’s Zestimate and Redfin’s Estimate are the most popular examples, using mathematical modeling and public data to generate property values. While undeniably convenient, understanding their limitations is crucial before relying on them for pricing decisions.
How AVM Algorithms Work
AVMs operate by aggregating vast amounts of data:
- Public records including tax assessments, deeds, property transfers, and parcel maps
- MLS data covering listings, pending sales, and recent closings
- Proprietary algorithms that weight various factors based on each company’s unique formula
The entire process is quantitative—no human ever looks at your home, walks through your renovated kitchen, or assesses your neighborhood’s unique appeal. The algorithm simply crunches numbers and produces an estimate.
The Critical Error Rate Data
Both Zillow and Redfin publish their accuracy rates, and the numbers reveal significant limitations, especially for homes not currently on the market:
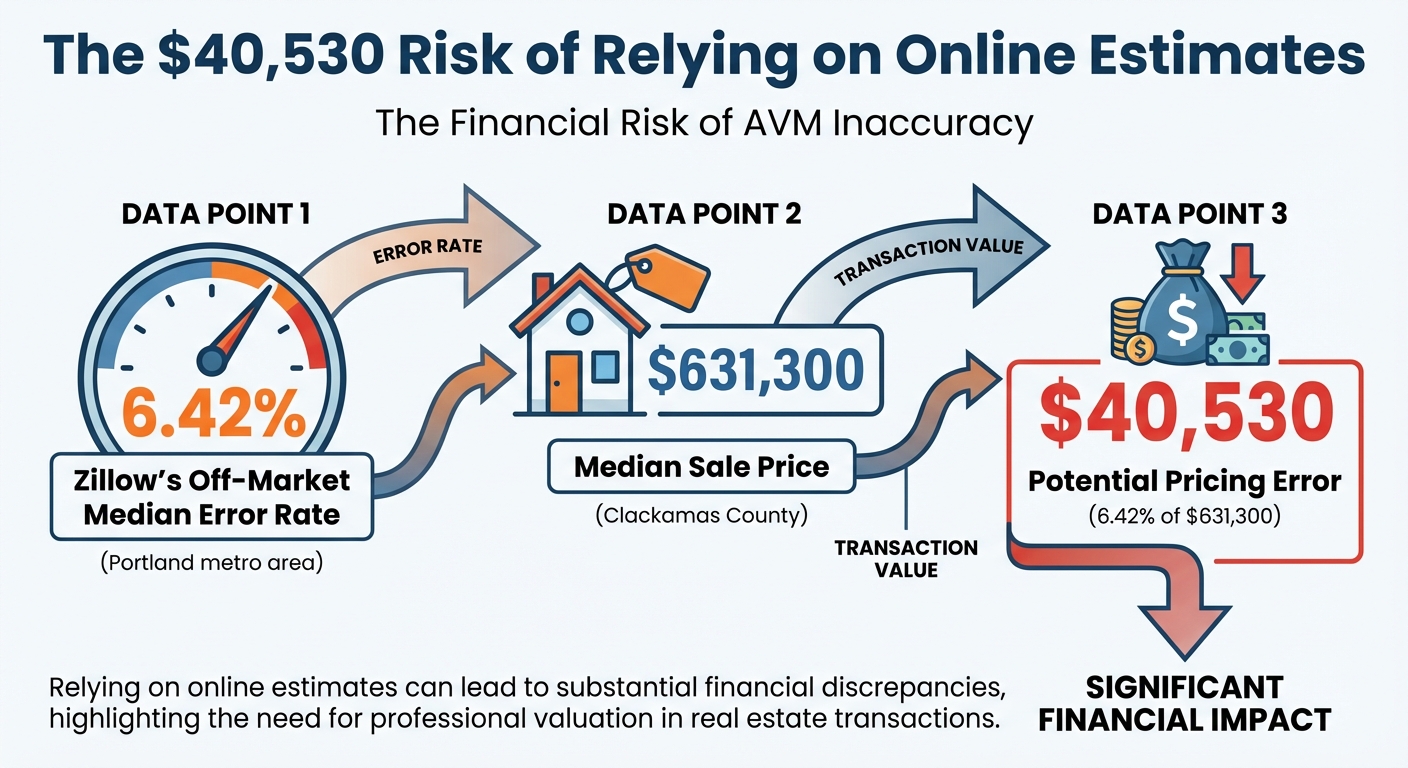
For Portland Metro (which includes Clackamas County):
- Zillow Zestimate: 1.88% median error for on-market homes, but 6.42% for off-market homes
- Redfin Estimate: 1.76% median error for on-market homes, but 5.86% for off-market homes
The Real Dollar Impact
A 6.42% error on Clackamas County’s median home price of $631,300 equals a potential $40,530 valuation error. That’s not a rounding error—it’s real money that could disappear from your proceeds or cause your home to languish on the market.
Why are on-market homes more accurate? Because the algorithm uses your list price (which came from a CMA) as a primary data point—essentially, it’s correcting itself with human expertise.
What AVMs Cannot “See”
The fundamental limitation of automated valuations is their inability to assess qualitative factors:
- Property condition: Is your home meticulously maintained or showing its age?
- Quality of renovations: Did you install $15,000 quartz countertops or $3,000 laminate?
- Unique features: That stunning Mt. Hood view or backyard oasis doesn’t register
- Hyper-local nuances: Being inside vs. outside a top school district boundary
- Forward-looking trends: Is your neighborhood appreciating faster than surrounding areas?
Expert Insight: Freddie Mac, one of the nation’s largest mortgage purchasers, states that while AVMs are valuable for portfolio analysis, they should not substitute for comprehensive individual property valuation due to their inability to assess condition.
Data Aggregation vs. Expert Interpretation: Why the Difference Matters to Your Bottom Line
The fundamental distinction between a CMA and an AVM comes down to interpretation versus calculation. One provides an opinion of value based on expert analysis; the other provides a mathematical estimate based on data patterns.
Head-to-Head Comparison
| Feature | Professional CMA | Automated AVM |
|---|---|---|
| Methodology | Human expert interpretation | Statistical modeling |
| Data Sources | Curated MLS, physical inspection, local knowledge | Public records, broad MLS data |
| Property Condition | Primary factor via walkthrough | Completely ignored |
| Renovations | Adjusted for quality and ROI | Largely invisible |
| Unique Features | Accounts for views, floor plans, ADUs | Cannot quantify subjective value |
| Market Nuances | Hyper-local trends, school boundaries | Broad ZIP/city-level data |
| Output | Suggested price range with strategy | Single specific dollar figure |
Real-World Case Study: The $75,000 West Linn Renovation Miss
The Scenario: A homeowner in West Linn owns a 2,500 sq. ft. home that recently underwent a $100,000 high-end kitchen and bathroom renovation featuring custom cabinets, quartz countertops, and luxury fixtures.
The AVM Estimate: $850,000, based on recent sales of similar-sized homes in the area.
The Problem: The algorithm couldn’t see that the comparable homes had original 1990s finishes, while this home was completely updated.
The CMA Recommendation: $925,000, after the agent personally inspected the quality of the renovations, selected comps with similar updates, and applied appropriate adjustments based on industry ROI data showing kitchen and bathroom remodels return over 90% of their investment in the Pacific region.
The Financial Impact: Relying on the AVM would have meant leaving $75,000 on the table.
Real-World Case Study: The $60,000 Wilsonville Location Premium
The Scenario: Two identical 2,200 sq. ft. homes built by the same builder in the same year. House A sits on a main thoroughfare. House B is three streets away on a quiet cul-de-sac backing to a protected nature preserve.
The AVM Valuation: Both valued at approximately $700,000—the algorithm sees identical size, age, and ZIP code.
The Problem: AVMs cannot differentiate between the noise and traffic exposure of a main road versus the premium tranquility and nature views of a protected green space.
The CMA Differentiation: House A priced at $690,000, House B priced at $750,000.
The Financial Impact: The location nuance alone created a $60,000 value difference that the AVM completely missed.
Price It Right or Pay the Price: The Financial Consequences of Mis-Pricing Your Home
Your initial list price is more than a number—it’s a marketing strategy that sets expectations and drives buyer behavior. Get it wrong in either direction, and the consequences are measurable and costly.
The Overpricing Trap
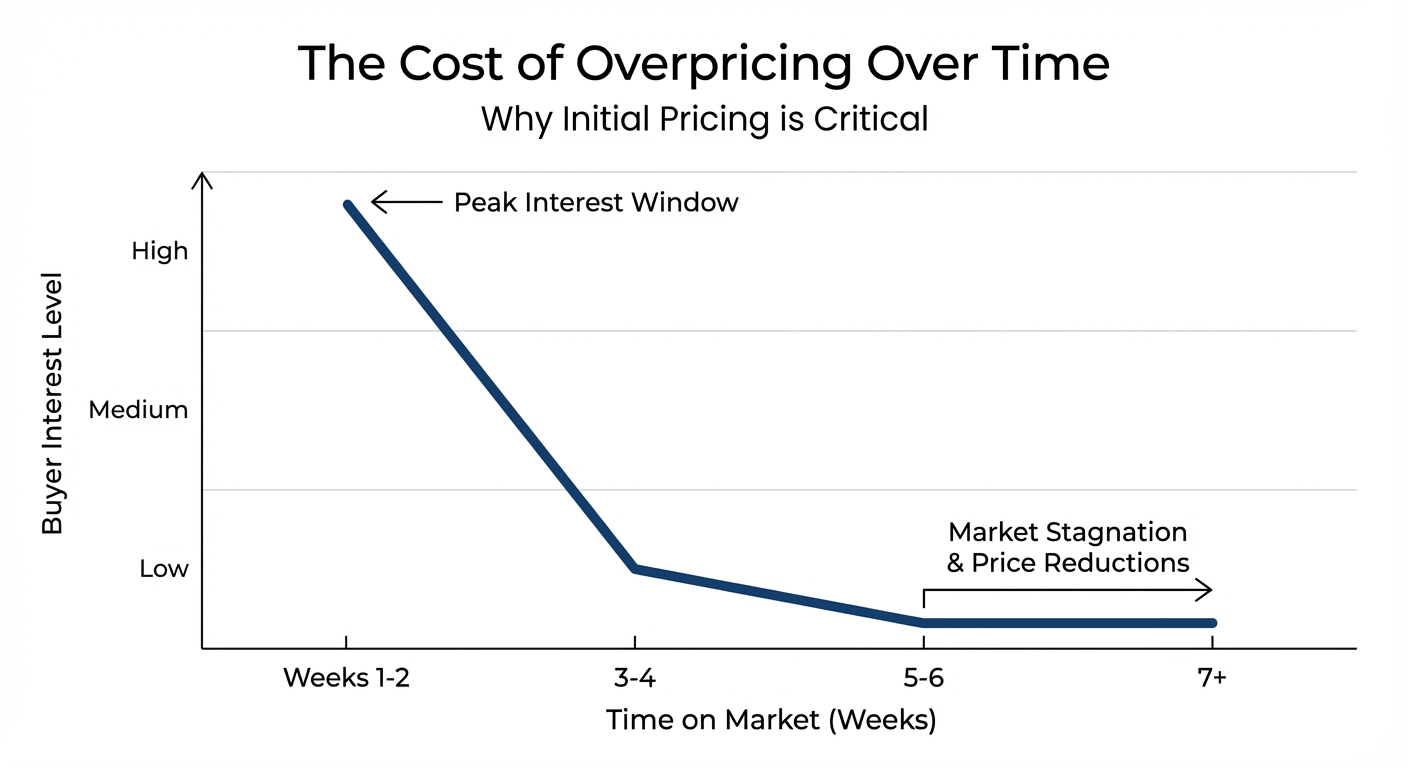
Research consistently shows that the highest level of buyer interest occurs in the first two to three weeks after a listing goes live. An overpriced home misses this critical window entirely.
Market Stagnation Effect
In Clackamas County where the average days on market is 42, a home sitting for 60-90 days becomes “stale inventory.” Buyers begin to wonder what’s wrong with the property. Is there a structural issue? A difficult seller? A hidden problem? Even if none of these are true, perception becomes reality.
The Price Reduction Spiral
Homes that undergo price reductions ultimately sell for lower percentages of their original list price compared to homes priced correctly from the start. Each reduction signals that the seller overestimated value, emboldening buyers to offer even less.
Appraisal Failure Risk
Even if you find a buyer willing to pay your inflated price, the transaction can still fail if the property doesn’t appraise for the contracted amount. This forces renegotiation or cancellation, wasting weeks or months while your home sits off-market.
Lost Opportunity Cost
Every month your home sits unsold, you’re paying mortgage interest, property taxes, insurance, and maintenance costs. You’re also delaying access to your equity for your next purchase or life plans.
The Underpricing Risk
While less common than overpricing, accidentally undervaluing your home can be equally costly.
Leaving Equity on the Table
In a market where homes sell at 100% of list price, pricing your home 5% below its true value means losing $31,565 on a median-priced Clackamas County home. There’s no second chance to capture that lost equity.
When Strategic Underpricing Works
In extremely hot markets, experienced agents sometimes intentionally price slightly below market value to trigger multiple offers and a bidding war. This is a calculated strategy with specific timing and conditions—very different from accidental undervaluation.
The Professional Partnership
This is why 89% of successful home sellers work with real estate agents. The stakes are simply too high to guess or rely solely on automated estimates.
The Pricing Sweet Spot
Properties priced accurately from day one enjoy distinct advantages:
- Sell faster, at or below the 42-day county average
- Generate maximum showings and offers during the critical first weeks
- Sell at or above asking price (matching the 100% county ratio)
- Avoid the stigma and price depression of reductions
- Maximize seller net proceeds after all costs
Final Thoughts
Automated valuation models have given homeowners unprecedented access to property data and serve as an excellent starting point for understanding your home’s potential value. For casual curiosity or rough estimates, they’re remarkably useful tools.
However, their fundamental inability to assess condition, renovations, and the hyper-local nuances that define Clackamas County’s diverse micro-markets creates valuation gaps worth tens of thousands of dollars. A median error rate of 6.42% translates to over $40,000 on our county’s typical home—money you could lose or leave on the table.
The synergy of big data analysis and boots-on-the-ground local expertise is what creates accurate, strategic pricing. Technology provides the foundation, but human insight builds the complete picture. An algorithm can tell you what similar homes sold for; an experienced agent can tell you why your home will command more or less—and how to position it for maximum impact.
With potential errors exceeding $40,000 and the difference between a 42-day sale and months of market stagnation, professional guidance isn’t optional in today’s market—it’s essential. An accurate home price isn’t just a number; it’s a marketing strategy that positions your property for success from day one.
Ready to Discover Your Home’s True Market Value?
Contact GW Hartley IV for a complimentary, no-obligation Comparative Market Analysis tailored specifically to your Clackamas County property. Let’s ensure you price it right from the start and maximize your return.
References:
- Regional Multiple Listing Service (RMLS). (2024). Market Action Report – April 2024. https://www.rmlsweb.com/v2/public/media/marketstats.asp
- U.S. Census Bureau. (2023). American Community Survey 5-Year Estimates. https://data.census.gov/
- Oregon Department of Education. (2023). 2022-23 At-A-Glance Profiles and Oregon Statewide Report Card. https://www.oregon.gov/ode/schools-and-districts/reportcards/reportcards/Pages/default.aspx
- National Association of Realtors (NAR). (2022). Remodeling Impact Report. https://www.nar.realtor/research-and-statistics/research-reports/remodeling-impact-report
- The Appraisal Foundation. (2024). Uniform Standards of Professional Appraisal Practice (USPAP). https://www.appraisalfoundation.org/imis/TAF/Standards/Appraisal_Standards/USPAP/TAF/USPAP.aspx
- Downs, D. A., & Slade, B. A. (2011). A review of automated valuation models (AVMs). Journal of Real Estate Literature, 19(2), 273-290. https://www.jstor.org/stable/23343468
- Zillow. (2024). Zestimate Accuracy. https://www.zillow.com/z/zestimate/
- Redfin. (2024). How Accurate Is the Redfin Estimate? https://www.redfin.com/redfin-estimate
- Freddie Mac. (2022). Automated Valuation Models (AVMs): A Primer. https://sf.freddiemac.com/content/_assets/files/working-with-us/origination-underwriting/freddie-mac-avm-primer.pdf
- Fannie Mae. (2020). Working With Appraisers in a Changing Market. https://www.fanniemae.com/research-and-insights
- Zillow Group. (2022). Zillow Group Consumer Housing Trends Report 2022. https://www.zillow.com/research/zillow-group-report-2022-31796/
- National Association of Realtors (NAR). (2023). 2023 Profile of Home Buyers and Sellers. https://www.nar.realtor/research-and-statistics/research-reports/highlights-from-the-profile-of-home-buyers-and-sellers