
Table of Contents
If you’re considering investing in Portland’s rental market, you’re entering one of the Pacific Northwest’s most dynamic real estate landscapes. But here’s the truth that separates successful investors from those who struggle: understanding surface-level metrics like monthly rent isn’t enough. The Portland market—with its unique combination of strong appreciation potential, tight vacancy rates, and complex regulatory environment—demands a sophisticated analytical approach. The median home price in Portland hovers around $550,000 to $600,000, while the rental vacancy rate sits at just 4.6%. These numbers tell a story of opportunity, but they also reveal a market where properties rarely “cash flow” from day one. According to recent multifamily data, average cap rates in high-growth markets like Portland have compressed to around 4.0-5.5%, significantly lower than the national average of 5.2%. This means investors are accepting lower immediate returns in exchange for long-term wealth building through appreciation and equity growth. This guide will equip you with the essential tools to evaluate rental properties like a professional: capitalization rates, multiple ROI calculations, and Portland-specific factors that directly impact your bottom line. Whether you’re analyzing a Southeast Portland duplex or a Beaverton single-family home, you’ll learn how to build financial models that reveal true investment potential—not just hopeful projections.
Understanding Capitalization Rate: Your First Line of Analysis
What Cap Rate Actually Measures
The capitalization rate (cap rate) is the cornerstone metric for comparing investment properties on an apples-to-apples basis. It represents the unlevered annual return you’d expect if you purchased a property with all cash, providing a standardized way to evaluate different opportunities regardless of financing structure. The formula is deceptively simple:
But here’s where most investors go wrong: they use rough estimates for NOI instead of conducting rigorous analysis of actual operating expenses. In Portland’s market, this mistake can cost you tens of thousands of dollars in unexpected costs.
Calculating Net Operating Income: The Portland Reality
Net Operating Income is your property’s total income after subtracting all operating expenses—but before debt service, taxes, depreciation, and capital expenditures. The challenge is accurately projecting every expense category, which varies significantly by property type, age, and location within the metro area. Here’s the complete NOI formula:
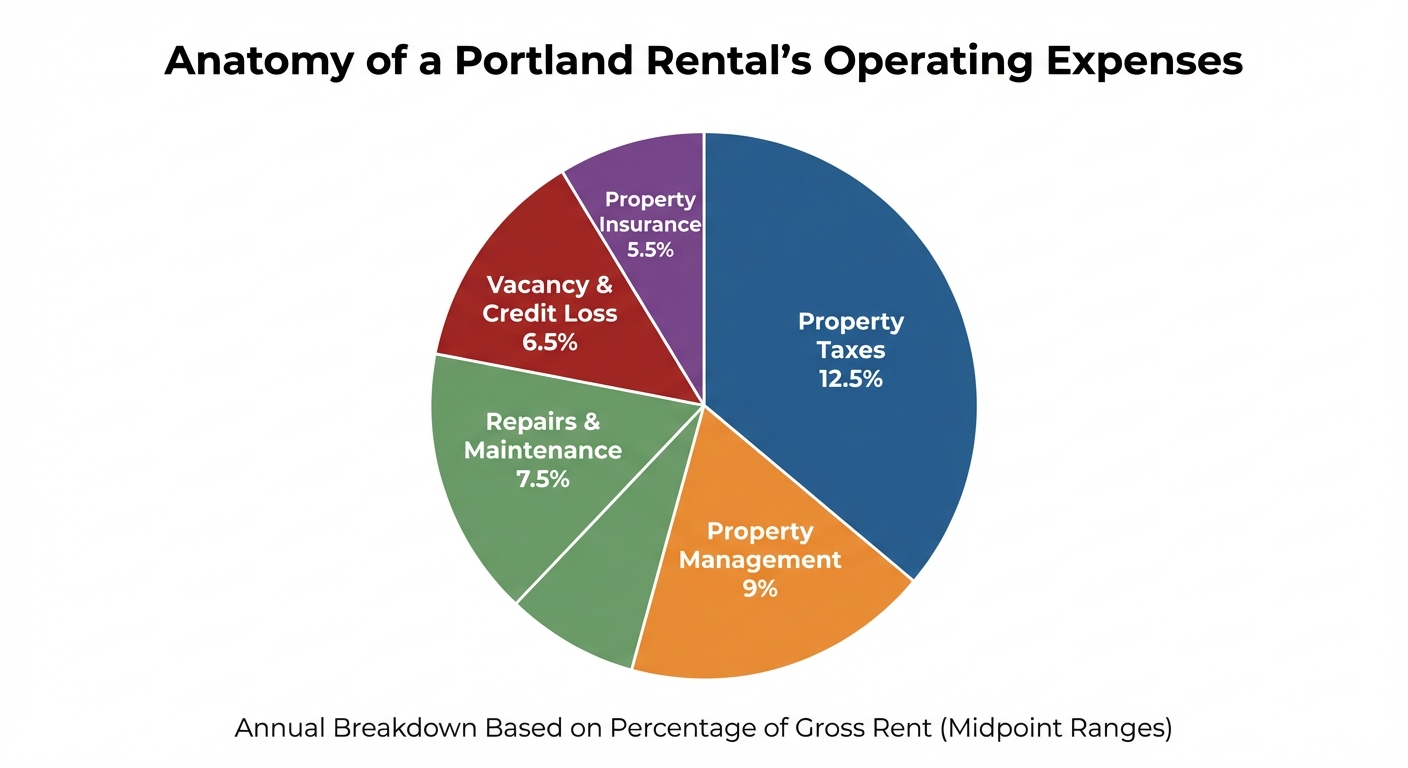
Let’s break down each expense category with Portland-specific data:
Property Taxes: The County Matters
Property taxes represent one of your largest expenses, typically consuming 10-15% of gross rental income. But here’s the critical detail: rates vary substantially by county. Multnomah County’s effective rate is approximately 1.05% of assessed value, while Washington County sits at 1.02% and Clackamas County at 0.95%. On a $600,000 property, this difference means $600 annually between counties—money that directly impacts your NOI. Always verify the exact tax rate with the county assessor before finalizing your analysis. Properties that have recently changed hands may see significant tax increases due to reassessment at market value.
Insurance: More Than a Standard Policy
Oregon’s average homeowners insurance runs about $1,114 annually, but landlord policies typically cost 25% more due to increased liability coverage requirements. Expect to budget 4-7% of gross rental income for insurance. Two Portland-specific considerations dramatically impact rates:
- Wildfire Risk: Properties in areas adjacent to the Urban Growth Boundary or near Forest Park face higher premiums
- Earthquake Preparedness: While earthquake insurance is optional, properties with seismic retrofitting may qualify for lower rates
Vacancy and Credit Loss: The Hidden Income Killer
Even in Portland’s tight rental market with a 4.6% vacancy rate, prudent underwriting requires budgeting 5-8% for vacancy and credit loss. Why budget above the market rate? Because this line item covers more than just empty units:
- Turnover Time: Even in high-demand neighborhoods, you’ll need 2-4 weeks between tenants for cleaning, repairs, and showings
- Non-Payment Risk: Oregon’s tenant-friendly eviction process means collecting unpaid rent can take months
- Seasonal Variation: Vacancy rates spike in winter months when fewer people move
Maintenance and Repairs: The 1% Rule in Practice
Budget 5-10% of gross rental income for routine maintenance, which translates to roughly 1% of the property value annually. A $600,000 property should have a $6,000 annual maintenance reserve. Older properties (pre-1980) should use the higher end of this range.
Common Maintenance Expenses in Portland:
- Plumbing repairs (especially in homes with galvanized pipes)
- Exterior painting (required every 5-7 years in the wet climate)
- HVAC servicing
- Appliance replacement
- Landscaping and gutter cleaning
Property Management: Professional vs. Self-Management
Professional property management in Portland typically costs 8-10% of collected rent, plus additional fees for leasing (often 50-100% of one month’s rent) and lease renewals. For a property generating $2,500 monthly rent, that’s $3,000-$3,600 annually plus one-time fees. Many new investors attempt self-management to save money, but this decision should factor in:
- Time Requirements: Expect 5-10 hours monthly per property for maintenance coordination, tenant communication, and financial tracking
- Legal Compliance: Portland’s Fair Access in Renting ordinances and statewide rent control require detailed knowledge
- Opportunity Cost: Could your time generate more income in your primary profession?
Utilities: Who Pays What
Single-family rentals typically pass all utilities to tenants. Multi-family properties often require landlords to cover water, sewer, and garbage. Portland’s utility rates—particularly for water and sewer—are among the highest in the region, with average bills exceeding $150 monthly for multi-unit properties. Always verify the utility structure before making an offer.
Interpreting Cap Rates in Portland’s Market Context
A “good” cap rate is entirely relative to market conditions, property quality, and growth potential. National multifamily averages around 5.2%, but Portland properties frequently trade at 4.0-5.5% cap rates. Why would investors accept lower returns? The answer lies in total return expectations. Portland’s long-term appreciation has historically exceeded national averages, with the S&P CoreLogic Case-Shiller Index showing consistent growth over the past decade. Investors accept lower current income in exchange for significant wealth building through property appreciation. Consider this comparison:
- Property A: 7.0% cap rate in a market with 2% annual appreciation
- Property B: 4.5% cap rate in Portland with 4-5% annual appreciation
Over a 10-year hold, Property B generates substantially higher total returns despite the lower cap rate, assuming the appreciation trends hold. This is Portland’s investment thesis in a nutshell.
Warning Signs of Problematic Cap Rates:
- Below 3.5%: Likely overpriced unless in an exceptional location with massive appreciation potential
- Above 6.5%: May indicate deferred maintenance, difficult tenants, or declining neighborhood conditions
Beyond Cap Rate: Calculating True Return on Investment
While cap rate is excellent for initial property comparison, it ignores the most powerful wealth-building tool in real estate: leverage. Most investors don’t pay cash; they finance 75-80% of the purchase price. This changes everything about return calculations.
Cash-on-Cash Return: Your Real Operating Performance
Cash-on-Cash (CoC) return measures the annual pre-tax cash flow relative to your actual out-of-pocket investment. This is the metric that determines whether a property generates monthly income or requires ongoing capital contributions.
Where:
- Annual Pre-Tax Cash Flow = NOI – Annual Debt Service
- Total Cash Invested = Down Payment + Closing Costs + Initial Repairs/Renovations
Here’s a real-world example using current Portland market conditions:
Scenario: Southeast Portland Duplex
- Purchase Price: $750,000
- Down Payment (25%): $187,500
- Closing Costs (2%): $15,000
- Initial Repairs: $5,000
- Total Cash Invested: $207,500
- Gross Annual Rent: $50,400 ($2,100/unit × 2 units × 12 months)
- Operating Expenses (35%): $17,640
- NOI: $32,760
- Loan Amount: $562,500
- Interest Rate: 6.5%
- Annual Debt Service: $42,689
Annual Cash Flow = $32,760 – $42,689 = -$9,929
Cash-on-Cash Return = -$9,929 / $207,500 = -4.78%
This negative cash flow is typical for new Portland acquisitions. The property isn’t generating monthly income—it’s requiring the investor to contribute nearly $10,000 annually. For many investors, this is a deal-killer. But this is where understanding total return becomes critical.
Total ROI: The Complete Wealth-Building Picture
Total ROI incorporates three wealth-building components:
- Cash Flow (which we’ve established may be negative initially)
- Principal Paydown (forced savings through mortgage amortization)
- Property Appreciation (market value increases)
Continuing our duplex example:
Year 1 Principal Paydown: $6,108 (from amortization schedule)
Annual Appreciation (4%): $30,000 ($750,000 × 0.04)
Total Return = -$9,929 + $6,108 + $30,000 = $26,179
Total ROI = $26,179 / $207,500 = 12.62%
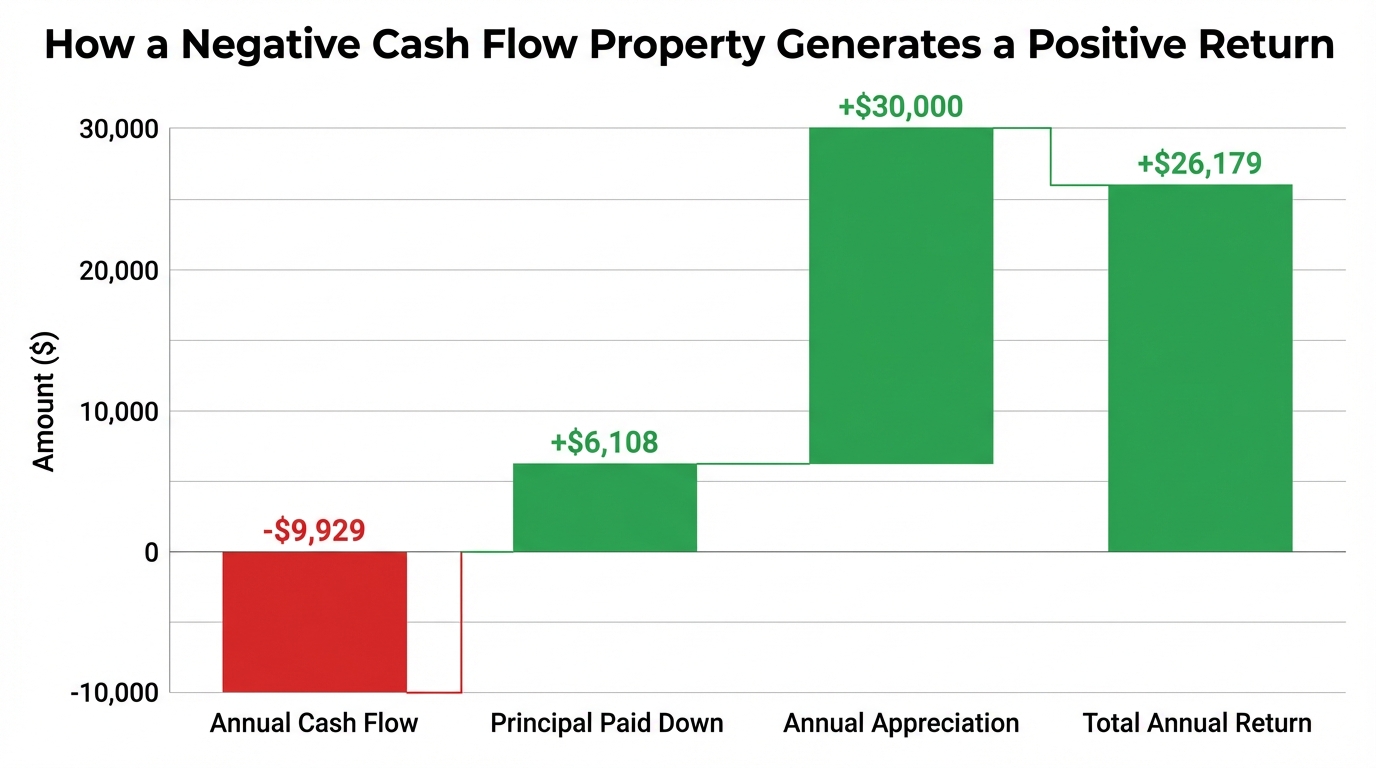
Suddenly, a property with negative cash flow shows a double-digit return. This is how Portland real estate builds wealth: through equity accumulation rather than monthly income.
The Power and Risk of Leverage
Leverage amplifies both gains and losses. With 25% down, you control 100% of the asset and capture 100% of its appreciation. If the property appreciates $30,000 annually, that’s a 16% return on your $187,500 down payment—before considering cash flow or principal paydown. But leverage also magnifies risk. Your fixed debt service remains constant regardless of rental income. If the market softens, vacancy increases, or major repairs arise, negative cash flow can quickly become unsustainable. The current interest rate environment makes this particularly relevant:

With rates fluctuating between 6-7% (compared to the 3-4% range of 2020-2021), debt service has increased dramatically. A $562,500 loan at 3.5% costs $30,343 annually; at 6.5%, it’s $42,689—a $12,346 difference that completely changes your cash flow profile.
Advanced Metric: Internal Rate of Return (IRR)
For sophisticated investors comparing real estate to stocks, bonds, or other investments over a multi-year period, the Internal Rate of Return (IRR) is the gold standard. IRR calculates the discount rate that makes the net present value of all cash flows—initial investment, annual cash flows, and final sale proceeds—equal to zero. In practical terms, IRR answers: “What annualized return am I earning over my entire hold period, accounting for the time value of money?” While complex to calculate manually (use Excel’s =IRR function or specialized real estate software), IRR provides the most accurate comparison between different investment opportunities. A well-managed Portland rental property might target a 12-15% IRR over a 7-10 year hold period, factoring in conservative appreciation and strategic value-add improvements.
Case Study: Comparative Analysis of Two Portland Properties
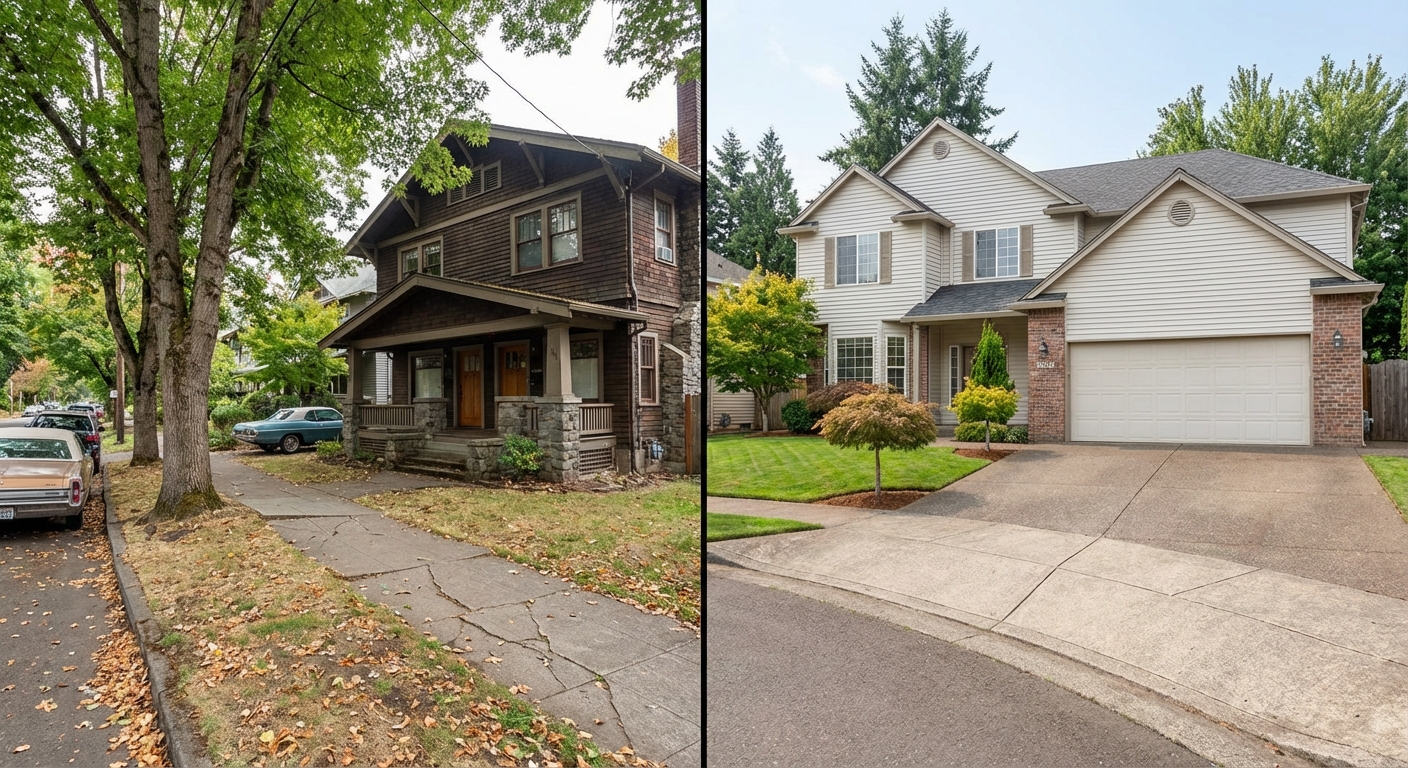
Let’s compare two actual investment scenarios to illustrate how these metrics work together to inform decision-making.
Property Profiles
Property A: SE Portland Duplex
- Purchase Price: $750,000
- Location: Montavilla neighborhood
- Gross Monthly Rent: $4,200 ($2,100 per unit)
- Property Type: 1920s construction, updated
- Financing: 25% down, 6.5% interest rate
- Appreciation Assumption: 4.0% annually
Property B: Beaverton Single-Family Home
- Purchase Price: $600,000
- Location: Near Progress Ridge
- Gross Monthly Rent: $2,900
- Property Type: 1990s construction, good condition
- Financing: 25% down, 6.5% interest rate
- Appreciation Assumption: 4.5% annually
Year 1 Financial Analysis Comparison
| Metric | SE Portland Duplex | Beaverton SFH |
|---|---|---|
| Purchase Price | $750,000 | $600,000 |
| Down Payment (25%) | $187,500 | $150,000 |
| Closing Costs (2%) | $15,000 | $12,000 |
| Initial Repairs | $5,000 | $3,000 |
| Total Cash Invested | $207,500 | $165,000 |
| Gross Annual Income | $50,400 | $34,800 |
| Operating Expenses | $17,640 (35%) | $10,440 (30%) |
| Net Operating Income | $32,760 | $24,360 |
| Cap Rate | 4.37% | 4.06% |
| Annual Debt Service | $42,689 | $34,151 |
| Annual Cash Flow | -$9,929 | -$9,791 |
| Cash-on-Cash Return | -4.78% | -5.93% |
| Principal Paid Down | $6,108 | $4,886 |
| Annual Appreciation | $30,000 | $27,000 |
| Total Annual Return | $26,179 | $22,095 |
| Total ROI | 12.62% | 13.39% |
Critical Insights from the Comparison
- Both Properties Have Negative Cash Flow: This is standard in today’s Portland market with 6.5% interest rates. Neither property generates monthly income in year one.
- Total ROI Tells a Different Story: Despite negative cash flow, both properties generate double-digit total returns when factoring in appreciation and principal paydown.
- The Beaverton SFH Edges Out on Total ROI: Despite a lower cap rate, the SFH’s lower initial investment and slightly higher appreciation assumption yield a marginally better first-year total return.
- Operating Expense Ratios Matter: The duplex carries a 35% expense ratio versus 30% for the SFH, primarily due to higher maintenance on an older building and increased management complexity with multiple units.
- Both Investments Require Long-Term Perspective: Neither property suits an investor seeking immediate passive income. The investment thesis relies on building equity through market appreciation and loan paydown.
Which Property Is Better?
The answer depends entirely on your investment goals and risk tolerance:
Choose the Duplex if:
- You want lower per-unit vacancy risk (one vacant unit still generates income)
- You value being in a more urban, central Portland location
- You’re comfortable with slightly lower total ROI in exchange for better cash flow stability
- You see potential for rent growth in the gentrifying Montavilla neighborhood
Choose the Single-Family Home if:
- You want maximum total ROI efficiency
- You prefer simpler management with a single tenant
- You believe suburban markets will outperform urban areas
- You want lower operating expenses and maintenance complexity
Neither choice is objectively “better”—both are viable investments with distinct risk/return profiles.
Portland-Specific Factors That Impact Your Bottom Line
Beyond the numbers, several unique Portland market characteristics directly affect investment performance. Ignoring these factors leads to flawed analysis and unexpected costs.
Regulatory Environment: Rent Control and Tenant Protections
Oregon’s statewide rent control legislation (Senate Bill 608) fundamentally changed the investment landscape. The law caps annual rent increases at 10% plus the Consumer Price Index (CPI) for the West Region. For 2024, the maximum allowable increase was 10.0%.
Critical Implications for Investors:
- Income Growth Constraints: You cannot simply raise rents to market rates when a tenant vacates. If your property is underrented, you’re limited in how quickly you can correct this.
- Long-Term Tenant Advantage: Tenants who stay for many years will have below-market rents, suppressing your NOI growth.
- Value-Add Limitations: Traditional “buy, renovate, raise rents” strategies are constrained by the 10% + CPI cap unless units are vacant.
Portland adds additional layers of complexity through the Fair Access in Renting (FAIR) ordinances, which dictate:
- Prohibited screening criteria (e.g., credit score minimums)
- Required consideration of alternative screening factors
- Limitations on security deposits and fees
Perhaps most importantly, Portland requires mandatory relocation assistance payments to tenants in certain situations: qualifying no-cause terminations, certain rent increases, or property demolition. These payments can reach $4,500 or more per tenant, representing a significant exit cost if you decide to renovate or redevelop.
Zoning Revolution: The Residential Infill Project
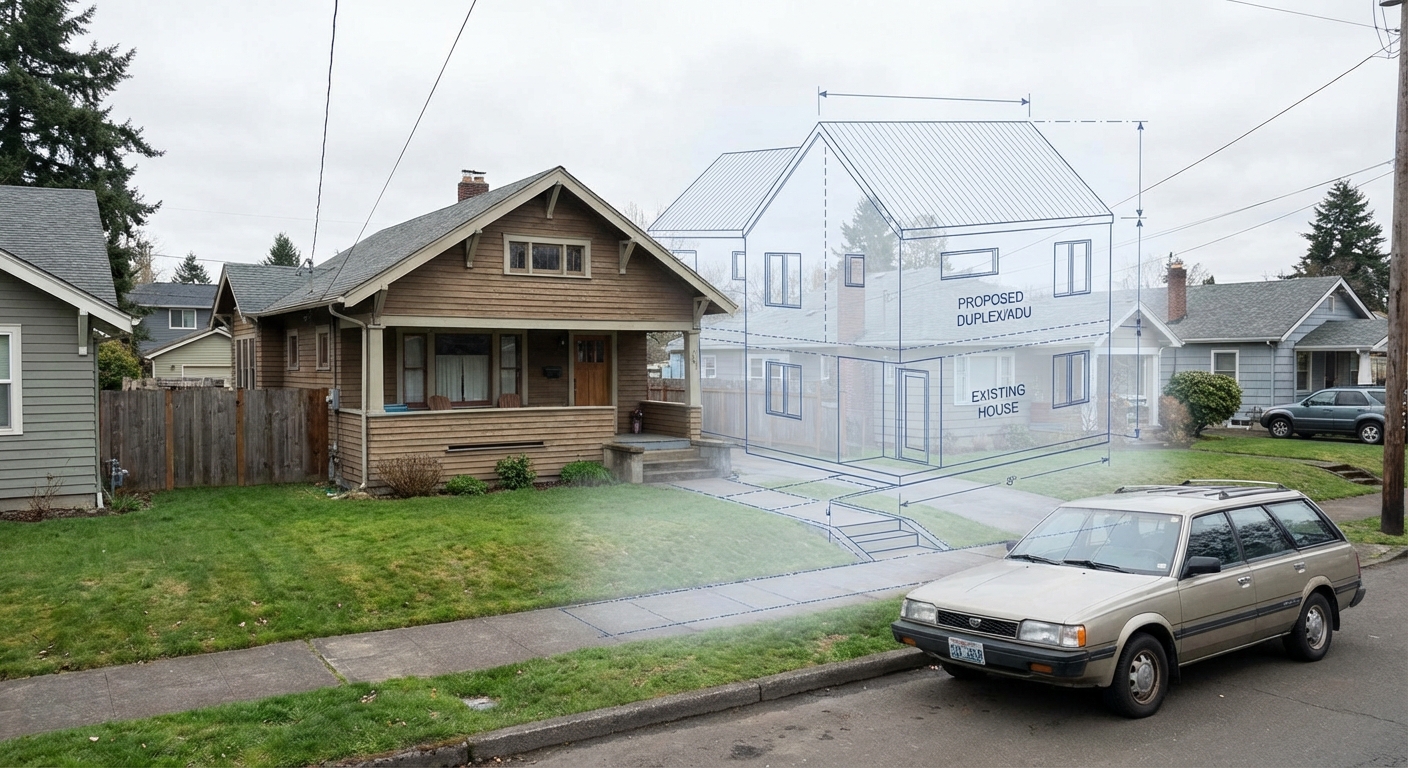
Portland’s Residential Infill Project (RIP) represents the most significant zoning change in decades. Adopted in 2021, RIP allows:
- Duplexes on most lots previously zoned for single-family homes
- Triplexes and fourplexes on larger lots (over 7,000 sq ft)
- Additional ADUs (Accessory Dwelling Units) beyond primary structures
Investment Opportunity:
Properties with RIP development potential trade at premiums, but the value-add opportunity can be substantial. A $600,000 single-family home that can be converted to a triplex might generate:
- Current Income: $2,900/month (SFH rental)
- Post-Development Income: $6,300/month (three $2,100 units)
This 117% income increase dramatically changes the property’s value and investment returns. Always analyze a property’s maximum development potential under RIP regulations.
Economic Drivers: Why Portland’s Market Remains Strong
Portland’s economy rests on several pillars that support continued housing demand:
- Technology Sector: The “Silicon Forest” continues expanding, with major employers like Intel, Amazon, Google, and numerous startups driving job growth.
- Manufacturing: Nike’s global headquarters, Columbia Sportswear, and advanced manufacturing facilities provide stable, high-wage employment.
- Healthcare: OHSU (Oregon Health & Science University) and Legacy Health are massive employers with consistent hiring.
- Population Growth: Despite some recent out-migration during the pandemic, the Portland metro area’s population continues its long-term growth trajectory, with Portland State University projecting continued expansion.
Market Indicators to Monitor:
- Oregon Employment Department monthly jobs reports
- Regional GDP growth
- Migration patterns from the Census Bureau
- Wage growth in key sectors
Strong fundamentals support long-term appreciation assumptions, but always stress-test your models with lower appreciation scenarios (2-3%) to ensure adequate safety margins.
Tax Strategies: Maximizing After-Tax Returns
Understanding tax benefits is crucial because after-tax return is what actually matters to your wealth building.
Key Federal Tax Benefits:
- Depreciation: You can depreciate the property’s structure (not land) over 27.5 years. On a $600,000 property with $450,000 in improvements, that’s $16,364 annually in “paper losses” to offset taxable income.
- Expense Deductions: Every dollar of operating expenses, mortgage interest, insurance, and professional fees is deductible against rental income.
- 1031 Exchanges: Defer capital gains taxes indefinitely by exchanging into new investment properties. This powerful strategy allows you to continuously upgrade your portfolio without tax friction.
- Opportunity Zones: Certain Portland neighborhoods qualify as Opportunity Zones, offering potential capital gains deferral and reduction for investments held long-term.
Local Tax Considerations:
Portland occasionally offers property tax abatements for:
- New multi-unit construction in targeted areas
- Affordable housing development
- Historic property renovation
These incentives can reduce operating expenses by thousands of dollars annually, dramatically improving cash flow. Always check with the Portland Housing Bureau for current programs before acquiring or developing property.
Building Your Investment Decision Framework
After analyzing all these factors, how do you actually make a decision? Here’s a systematic framework:
Step 1: Establish Your Investment Criteria
Before looking at properties, define your requirements:
- Minimum Cash-on-Cash Return: Are you willing to accept negative cash flow? For how long?
- Target Total ROI: What total return justifies the risk? (10%? 12%? 15%?)
- Hold Period: Are you buying for 3-5 years or 10+ years? This dramatically affects which metrics matter most.
- Risk Tolerance: Can you sustain negative cash flow if vacancies increase or major repairs arise?
- Time Commitment: Will you self-manage or hire professionals?
Step 2: Conduct Rigorous Due Diligence
For every property under consideration:
1. Verify Actual Expenses
Don’t rely on seller-provided expense estimates. Request:
- Three years of property tax statements
- Insurance quotes from multiple providers
- Utility bills if landlord-paid
- Maintenance records
2. Inspect Thoroughly
Pay for professional inspections covering:
- Structure and foundation
- Roof condition and remaining life
- Plumbing (particularly for galvanized pipes)
- Electrical system capacity
- HVAC age and efficiency
3. Analyze Rent Comparables
Don’t assume the current rent is market rate. Research:
- Recent leases in the same building (for multi-family)
- Comparable properties within 0.5 miles
- Rent trends over the past 12-24 months
4. Verify Zoning and Development Potential
Check with Portland’s Bureau of Development Services:
- Current zoning designation
- RIP eligibility and constraints
- Any existing code violations or compliance issues
Step 3: Build Conservative Financial Models
Create spreadsheets modeling the investment over your intended hold period:
Conservative Assumptions:
- Vacancy: 6-8% (even if the market is tighter)
- Rent Growth: 3-4% annually (below historical averages but aligned with rent control constraints)
- Expense Growth: 4-5% annually (inflation plus some)
- Appreciation: 3-4% annually (below long-term averages for safety margin)
- Capital Reserves: 5-10% of gross rent set aside for major repairs
Stress Test Scenarios:
- What if appreciation is only 2% annually?
- What if interest rates rise and you need to refinance at 8%?
- What if a major tenant vacates and the unit sits empty for 90 days?
- What if you need a $20,000 roof replacement in year three?
If the investment still meets your return thresholds under conservative scenarios, it’s likely a solid opportunity.
Step 4: Compare Alternatives
Never analyze a property in isolation. Always have alternative investments for comparison:
- Other Portland Properties: How does this opportunity compare to similar properties in different neighborhoods?
- Alternative Markets: Could you achieve better risk-adjusted returns in Vancouver, WA or Salem?
- Other Asset Classes: What return could this capital generate in stocks, bonds, or syndicated investments?
Remember: choosing to invest in Property A means choosing not to invest that capital elsewhere. Opportunity cost is real.
Final Thoughts
Successful rental property investing in Portland requires far more than finding a house and renting it out. The market’s high property values, compressed cap rates, regulatory complexity, and unique development opportunities demand sophisticated analysis and strategic thinking. The investors who thrive in this market understand several fundamental truths:
- Cash Flow Often Comes Later: Portland investments typically build wealth through appreciation and equity accumulation, not immediate monthly income. If you need cash flow today, look elsewhere or adjust your expectations.
- The Details Matter Enormously: Small differences in property taxes, insurance rates, or operating efficiency compound dramatically over a 10-year hold. Rigorous due diligence isn’t optional.
- Regulatory Compliance Is Non-Negotiable: Oregon’s tenant protections and Portland’s local ordinances create real financial consequences for non-compliance. Factor these constraints into every decision.
- Development Potential Creates Value: Understanding RIP zoning and identifying properties with hidden density potential can unlock substantial returns that simple cash flow analysis misses.
- Conservative Assumptions Protect Capital: Model with pessimistic scenarios. If an investment only works with optimistic assumptions, it’s too risky.
The tools you’ve learned in this guide—cap rate analysis, multiple ROI calculations, Portland-specific expense modeling, and comprehensive due diligence frameworks—provide the foundation for sound investment decisions. But remember: these are tools, not guarantees. Real estate investing always involves risk, and even the best analysis can’t predict every outcome. Your next step? Apply this framework to an actual property you’re considering. Build the spreadsheet. Run the scenarios. Compare alternatives. Make a decision based on data, not emotion. That’s how successful Portland investors are built—one analytical, disciplined decision at a time.
Ready to Navigate Portland’s Rental Market?
If you need expert guidance navigating Portland’s complex rental market, GW Hartley IV is here to help. With nearly 30 years of experience in the Portland real estate market and a proven track record of helping investors achieve their goals, GW combines strategic market analysis with personalized service to ensure you make informed decisions backed by local expertise.
References:
- Portland State University Population Research Center. (2023). Annual Population Report
- CBRE. (2024). U.S. Multifamily Figures Q4 2023
- Multnomah County Division of Assessment, Recording & Taxation. (2024). Property Tax Information and Rates
- Washington County, Oregon. (2024). Assessment & Taxation Department – Tax Rates
- Clackamas County, Oregon. (2024). Assessor’s Office – Tax Rate Information
- Forbes Advisor. (2024). Best Homeowners Insurance In Oregon
- U.S. Census Bureau. (2024). Quarterly Residential Vacancies and Homeownership, Fourth Quarter 2023
- Investopedia. (2023). Property Management Fees: What Landlords Should Expect
- Portland Water Bureau. (2024). Rates and Charges
- S&P Dow Jones Indices. (2024). S&P CoreLogic Case-Shiller Home Price Indices
- Federal Reserve Bank of St. Louis. (2024). 30-Year Fixed Rate Mortgage Average in the United States
- State of Oregon Legislative Assembly. (2019). Senate Bill 608
- Oregon Office of Economic Analysis. (2023). Maximum Annual Rent Increase for 2024
- The City of Portland, Oregon. (2024). Mandatory Renter Relocation Assistance
- The City of Portland, Oregon Bureau of Planning and Sustainability. (2021). Residential Infill Project
- Greater Portland Inc. (2024). Key Industries in the Greater Portland Region
- Internal Revenue Service. (2023). Publication 527, Residential Rental Property
- Portland Housing Bureau. (2024). Tax Exemptions and Financial Tools