
Table of Contents
- Why Location Matters More Than Ever in Portland’s Diverse Metro
- How to Evaluate Any Portland Metro City: 7 Critical Factors
- Comparing 16 Portland Metro Cities: The Data at a Glance
- Which City Fits Your Life? 4 Buyer Profiles Matched to Metro Neighborhoods
- Why Data Alone Won’t Find You the Perfect Home
- Key Takeaways
The Portland metropolitan area isn’t just one market—it’s a collection of 16+ distinct communities, each offering a unique blend of lifestyle, affordability, and opportunity. For homebuyers navigating this complex landscape, the stakes are high: choosing the wrong neighborhood can mean sacrificing quality schools, enduring grueling commutes, or stretching your budget beyond comfort.
Between 2010 and 2020, the Portland metro added an estimated 300,000 residents, intensifying competition for housing and making informed decision-making more critical than ever. Traditional real estate advice—relying on anecdotes or gut feelings—no longer cuts it in a market shaped by remote work trends, fluctuating interest rates, and Metro’s Urban Growth Boundary policies.
This guide introduces a 7-pillar decision framework designed to transform your home search from overwhelming to strategic. By analyzing quantitative data across housing costs, school quality, transportation infrastructure, tax burdens, and development trajectories, you’ll gain the clarity needed to match your priorities with the right community. Whether you’re drawn to Portland’s urban energy, Lake Oswego’s premium schools, or Hillsboro’s tech-driven growth, this framework will help you make a confident, data-backed choice.
Why Location Matters More Than Ever in Portland’s Diverse Metro
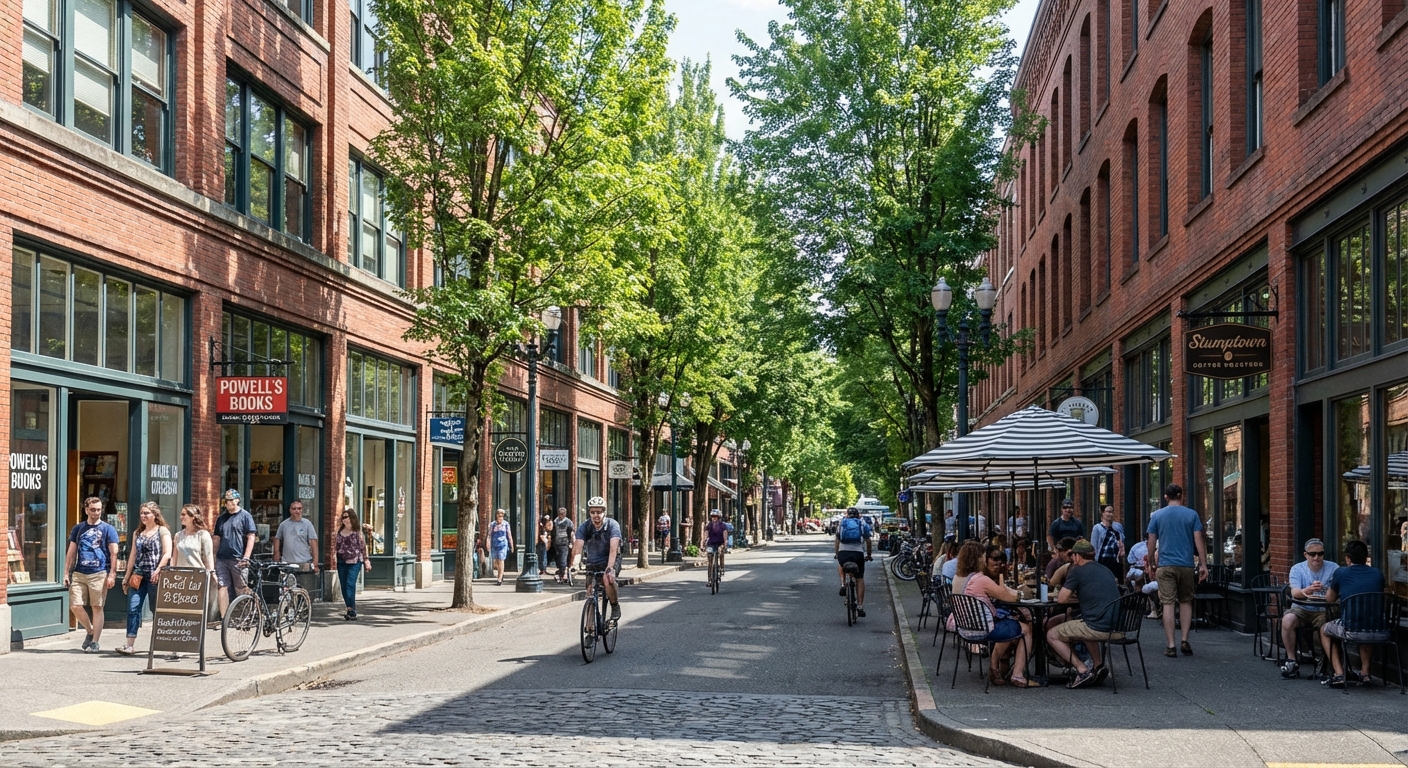
The Portland metro is shaped by unique policies and demographic forces that create vastly different living experiences across cities. Understanding these regional dynamics is the first step to strategic homebuying.
Metro’s Urban Growth Boundary (UGB) serves as a legal fence around urban development, protecting surrounding farms and forests while concentrating growth within its limits. This policy creates higher housing density and upward price pressure in desirable areas inside the boundary. For buyers, it means understanding which communities are positioned for future expansion versus those already built out.
The metro spans three distinct counties, each with its own economic identity. Multnomah County anchors the urban core with healthcare, professional services, and Portland’s vibrant neighborhoods. Washington County powers the region’s “Silicon Forest”—Intel alone employs over 22,000 people at its Hillsboro campus, creating a tech-centric job market that drives demand for housing throughout the westside. Clackamas County blends manufacturing, retail, and a mix of suburban and rural communities stretching from Milwaukie to Sandy.
The pandemic permanently reshaped buyer priorities. A 2022 National Association of Realtors study revealed that buyers now prioritize home offices, private outdoor space, and larger square footage over short commutes, reflecting the normalization of remote and hybrid work. This shift has redistributed demand across the metro, making once-distant suburbs more competitive.
The contrast between urban and suburban lifestyles is stark. Portland’s inner neighborhoods—Pearl District, Hawthorne, Slabtown—offer historic charm, walkability, and cultural amenities. Suburban cities like Happy Valley and Hillsboro counter with newer construction, larger lots, and master-planned communities designed around modern family needs. Over 30% of Hillsboro’s housing stock was built after 2000, compared to just 15% in Portland, reflecting the rapid suburban expansion that defines the region’s growth.
How to Evaluate Any Portland Metro City: 7 Critical Factors
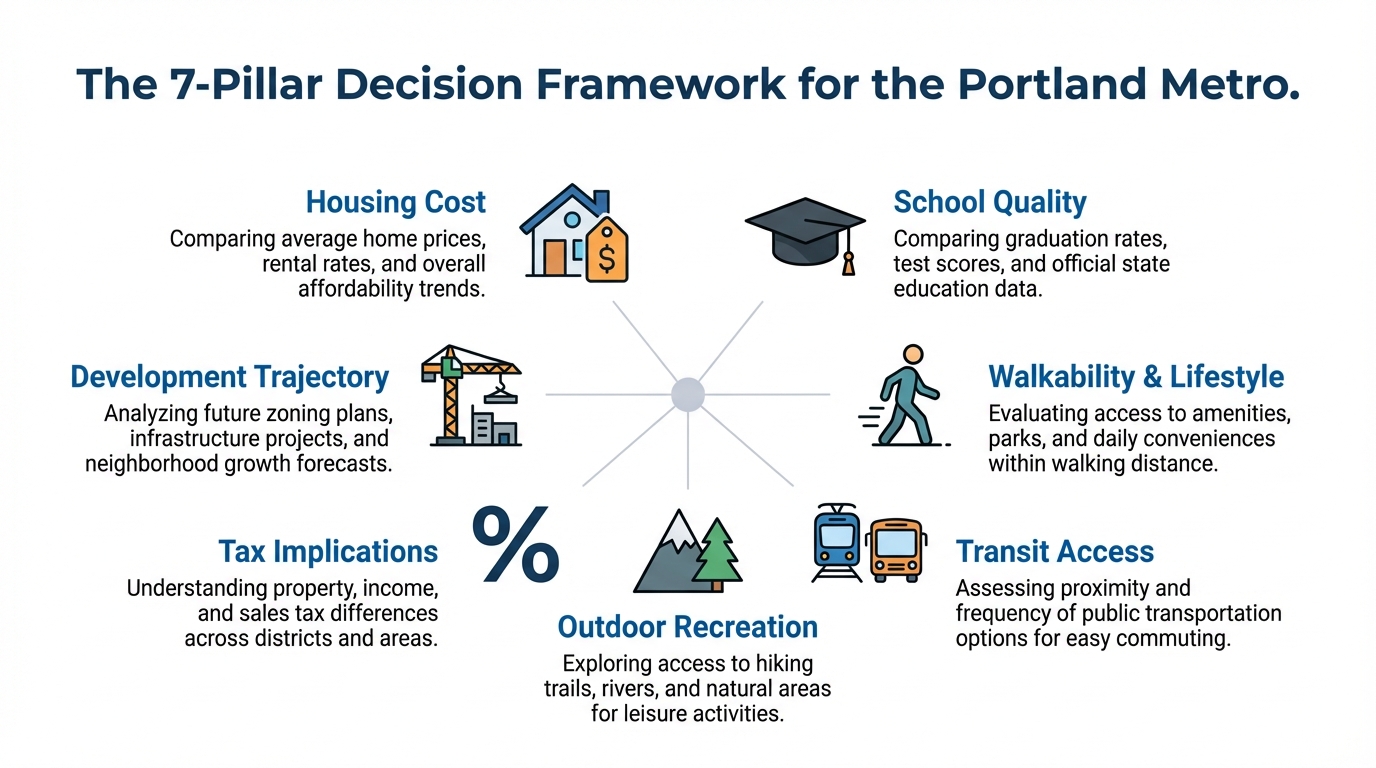
Before diving into city-by-city comparisons, understanding the seven evaluation pillars ensures you’re weighing what truly matters for your situation.
Pillar 1: Housing Cost & Affordability
The Portland metro’s median home price reached $560,000 in May 2024, but this regional average conceals dramatic local variation. Gresham’s median of $499,900 represents the most accessible entry point to metro living, while Lake Oswego’s $950,000 median reflects its established luxury market and top-tier schools.
Affordability extends beyond purchase price. Property taxes, homeowners insurance, HOA fees, and maintenance costs compound differently across cities. A $600,000 home in Tigard carries different long-term costs than the same-priced home in Portland due to varying tax rates and insurance premiums. Smart buyers calculate total monthly housing costs—not just mortgage payments—to understand true affordability.
Long-term appreciation potential also varies. Cities with major development projects, strong job growth, and limited available land tend to appreciate faster. Hillsboro’s tech corridor expansion and Oregon City’s waterfront revitalization signal future value growth, while established communities like Lake Oswego offer stability but slower appreciation.
Pillar 2: School Quality
For families, school quality often becomes a non-negotiable factor. Oregon’s statewide graduation rate stands at 81.3%, but district-level performance varies dramatically. Lake Oswego leads with a 96.1% graduation rate, followed closely by West Linn-Wilsonville at 95.8%. These districts consistently outperform state averages on standardized assessments and college readiness metrics.
School District Premium: The “Lake Oswego school district effect” adds an estimated 10-15% to home values compared to equivalent homes in neighboring areas. Beaverton and Tigard-Tualatin districts offer excellent alternatives with 92-94% graduation rates at more moderate price points.
Beyond test scores, consider program offerings. Does the district provide robust STEM, arts, or language immersion programs? What’s the student-to-teacher ratio? Visit campuses and talk to current parents—official data tells part of the story, but on-the-ground experience reveals classroom culture and community engagement.
Pillar 3: Walkability & Lifestyle
Walk Score® quantifies neighborhood walkability on a 0-100 scale, measuring proximity to amenities, pedestrian infrastructure, and street connectivity. Scores above 90 indicate “Walker’s Paradise” neighborhoods where daily errands don’t require a car. Scores below 50 signal car-dependent areas.
Portland’s city center scores 67—walkable but not fully car-free. Inner neighborhoods like the Pearl District and Hawthorne offer 80+ scores with grocery stores, cafes, and services within a few blocks. Suburban Damascus scores just 5, representing the metro’s most car-dependent environment with minimal sidewalk infrastructure and widely dispersed services.
Lifestyle extends beyond walkability. Consider each city’s cultural offerings: Beaverton hosts one of the region’s largest farmers markets. Milwaukie’s historic downtown features independent shops and breweries. Lake Oswego’s town center provides upscale dining and boutique shopping. Tigard’s Fanno Creek Trail system offers 15+ miles of connected pathways for recreation. Match these lifestyle factors to your daily priorities—a vibrant farmers market matters more if you cook at home frequently, while trail access matters most to active outdoor enthusiasts.
Pillar 4: Transit Access & Commute
TriMet’s MAX light rail system fundamentally shapes commute options across the metro. Five color-coded lines connect Portland City Center to Hillsboro (Blue Line), Gresham (Blue/Green Lines), Clackamas Town Center (Green Line), PDX Airport (Red Line), and Milwaukie (Orange Line). Living near a MAX station expands job access without car dependency and often adds a premium to home values.
The metro’s mean commute time is 26.6 minutes, but this average conceals wide variation. A downtown Portland resident commuting to Hillsboro’s tech corridor faces 45+ minutes during peak hours via Highway 26. Conversely, a Milwaukie resident working downtown enjoys a 20-minute MAX ride with no traffic stress.
Major corridors define commute patterns:
- Highway 26 connects Portland to Beaverton and Hillsboro but experiences severe congestion during tech company shift changes
- Interstate 5 serves as the primary north-south artery but crawls during rush hour
- I-205 provides eastern metro access but lacks parallel transit options
Consider not just current commute patterns but future flexibility. Remote work may continue, but what happens if you change jobs or your employer mandates office returns? Proximity to MAX stations and major corridors provides optionality.
Pillar 5: Outdoor Recreation
Pacific Northwest living centers on outdoor access. Metro directly manages over 18,000 acres of parks and natural areas, including Oxbow Regional Park’s old-growth forests and the Smith & Bybee Wetlands’ urban wildlife refuge. These regional destinations supplement city-specific parks.
The Tualatin Hills Park & Recreation District (THPRD) serves Beaverton and surrounding areas with 200+ parks and 70 miles of trails, making it one of Oregon’s largest park districts. Cities invest differently in recreation—compare Tigard’s extensive Fanno Creek Trail network to Gresham’s Main City Park serving as a community hub for events.
Geography matters. Sandy positions itself as the “Gateway to Mount Hood,” offering 45-minute access to alpine skiing, hiking, and mountain biking. West Linn and Lake Oswego provide direct Willamette River access for kayaking and fishing. Happy Valley’s Mt. Talbert Nature Park features summit trails with Cascade views. Match recreational priorities to available infrastructure—trail runners prioritize connected pathway systems, while families may value playgrounds and splash pads.
Pillar 6: Tax Implications
Oregon’s lack of sales tax is balanced by property and income taxes. Property taxes fund schools, fire services, libraries, and local infrastructure through overlapping tax districts. Measures 5 and 50 cap assessed value growth at 3% annually and limit overall tax rates, but significant variation remains between cities.
A $400,000 assessed value home generates vastly different tax bills across the metro:
| City | County | Tax Rate (per $1,000 AV) | Annual Tax on $400k |
|---|---|---|---|
| Portland | Multnomah | $23.40 | $9,360 |
| Beaverton | Washington | $19.50 | $7,800 |
| Lake Oswego | Clackamas | $18.20 | $7,280 |
Portland’s higher rate reflects Multnomah County’s arts tax, supportive housing levy, and Metro bonds. Lake Oswego’s lower rate results from a strong commercial tax base sharing the burden with residential properties. Over 30 years of homeownership, these differences compound to tens of thousands of dollars.
Beyond property taxes, consider Oregon’s progressive income tax structure when evaluating total tax burden. High earners may offset higher property taxes through Washington County’s lack of Metro-specific income levies, while lower earners benefit from Clackamas County’s relatively moderate combined rates.
Pillar 7: Development Trajectory
Future growth signals long-term value and livability. Cities actively planning infrastructure, attracting employers, and investing in quality of life improvements tend to appreciate faster and maintain community vitality.
Key development projects shaping the metro:
Hillsboro’s South Hillsboro represents Oregon’s largest residential development in decades—1,400 acres adding 8,000 homes over 20 years. This master-planned community includes schools, parks, and commercial space, fundamentally expanding the city’s capacity.
Oregon City’s Willamette Falls Legacy Project transforms a decommissioned industrial site into a public riverwalk, connecting downtown to the Willamette River and creating new recreation and economic opportunities. Completion could catalyze downtown revitalization similar to Portland’s Eastbank Esplanade.
Beaverton’s Downtown Redevelopment focuses on densifying around The Round and the Beaverton Central MAX station. New mixed-use buildings, pedestrian infrastructure, and public spaces aim to create a walkable urban core where none previously existed.
Portland’s Residential Infill Project allows duplexes, triplexes, and fourplexes on lots previously zoned for single-family homes. This city-wide rezoning aims to increase housing supply and density throughout established neighborhoods, potentially moderating price growth while changing neighborhood character.
Pro Tip: Review each city’s comprehensive plan and capital improvement program to gauge commitment to future development. Cities investing in parks, transit, and infrastructure demonstrate long-term planning that protects property values.
Comparing 16 Portland Metro Cities: The Data at a Glance
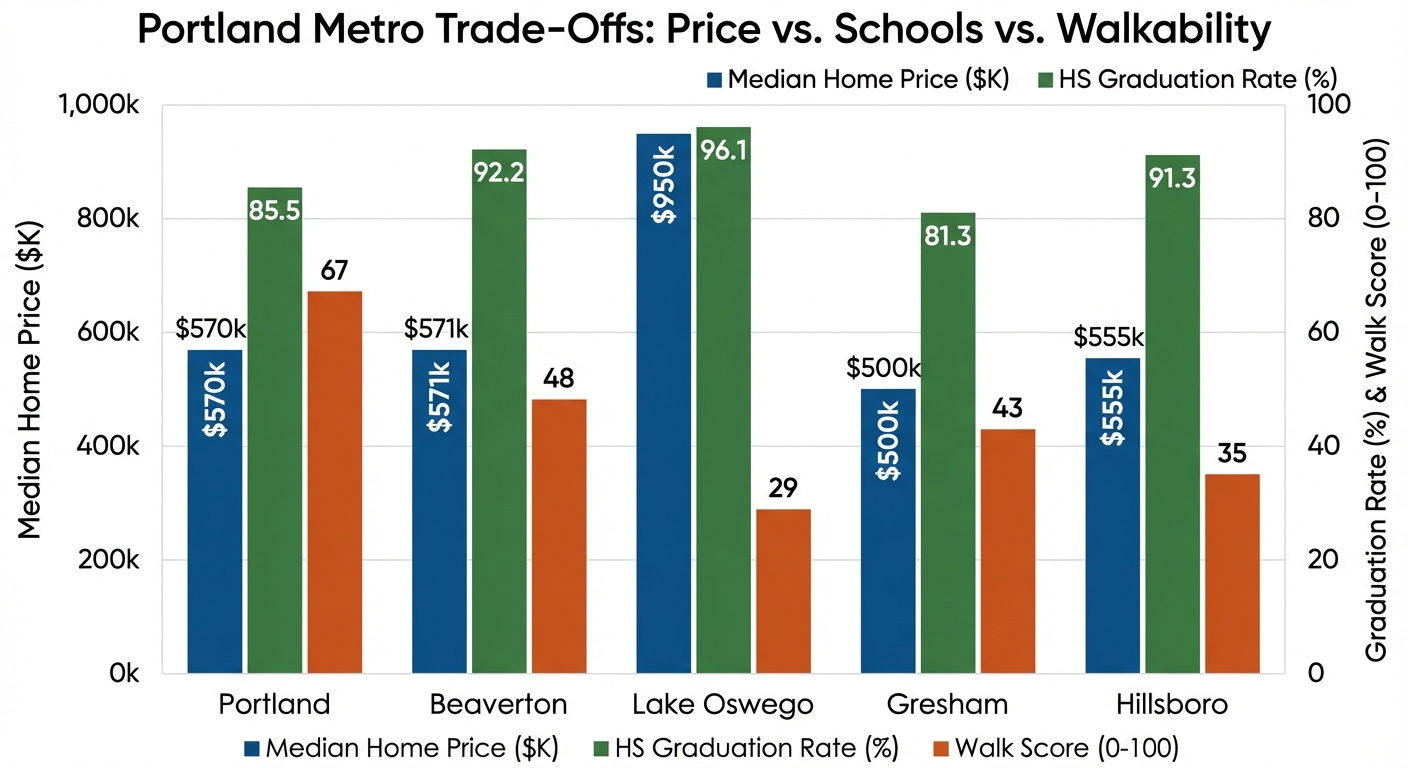
The comprehensive decision matrix below synthesizes all seven pillars across 16 metro cities, allowing direct comparison based on your priorities.
How to Read the Matrix
Each city is evaluated across median home price, high school graduation rate, Walk/Transit Scores, property tax rate, and development trajectory. Scores reflect May 2024 market data and 2022-23 school year performance. Use this table as a starting point, then dive deeper into cities that align with your weighted priorities.
Regional Patterns
Premium Markets: Lake Oswego ($950k), West Linn ($805k), and Happy Valley ($763k) command the highest prices but deliver top-tier schools and established amenities. These cities offer stability and prestige but limited affordability for first-time buyers.
Affordable Entry Points: Gresham ($500k), Oregon City ($565k), and Sandy ($538k) provide the most accessible pricing within the metro boundary. These communities offer growth potential as infrastructure and development projects mature.
Tech Corridor: Beaverton ($571k) and Hillsboro ($555k) balance moderate pricing with strong job markets and future development. Proximity to Intel, Nike, and hundreds of tech employers drives consistent demand.
Urban Core: Portland ($570k) leads in walkability (67) and transit access (53) but carries the highest property tax burden. The city’s diverse neighborhoods range from walkable Pearl District condos to car-dependent outer eastside homes.
Rural/Semi-Rural: Damascus (Walk Score 5) and Boring (Walk Score 10) offer large lots and privacy but extreme car dependency. These communities appeal to buyers prioritizing space and rural lifestyle over urban amenities.
Portland Metro Decision Matrix
| City | County | Median Price | HS Grad Rate | Walk | Transit | Tax Rate | Recreation | Development |
|---|---|---|---|---|---|---|---|---|
| Portland | Multnomah | $570,000 | 85.5% | 67 | 53 | $23.40 | Forest Park, 300+ parks | High (infill) |
| Beaverton | Washington | $571,000 | 92.2% | 48 | 41 | $19.50 | THPRD parks, trails | High (downtown) |
| Hillsboro | Washington | $555,000 | 91.3% | 35 | 29 | $20.10 | Jackson Bottom | Very High (tech) |
| Gresham | Multnomah | $500,000 | 81.3% | 43 | 38 | $24.50 | Main City Park | Moderate |
| Lake Oswego | Clackamas | $950,000 | 96.1% | 29 | 24 | $18.20 | Tryon Creek | Stable (luxury) |
| Tigard | Washington | $600,000 | 93.9% | 39 | 33 | $19.80 | Fanno Creek Trail | High (retail) |
| West Linn | Clackamas | $805,000 | 95.8% | 22 | 19 | $19.70 | Willamette River | Stable (infill) |
| Oregon City | Clackamas | $565,000 | 82.5% | 33 | 29 | $21.60 | Willamette Falls | High (waterfront) |
| Happy Valley | Clackamas | $763,000 | 89.2% | 16 | 19 | $21.10 | Mt. Talbert Park | Very High (new) |
| Milwaukie | Clackamas | $549,000 | 89.2% | 49 | 40 | $22.50 | MAX Orange Line | High (downtown) |
| Tualatin | Washington | $631,000 | 93.9% | 32 | 26 | $19.80 | Tualatin Commons | Moderate |
| Wilsonville | Clackamas | $637,000 | 95.8% | 31 | — | $19.30 | Villebois community | High (planned) |
| Clackamas | Clackamas | $600,000 | 89.2% | 30 | 28 | $21.10 | Three Creeks | Moderate (retail) |
| Damascus | Clackamas | $793,000 | 81.3% | 5 | — | $21.50 | Rural lifestyle | Low (uncertain) |
| Sandy | Clackamas | $538,000 | 84.8% | 51 | — | $20.80 | Mt. Hood gateway | Moderate (tourism) |
| Boring | Clackamas | $693,000 | 81.3% | 10 | — | $21.50 | Springwater Trail | Low (rural) |
Specific Highlights
Milwaukie offers an undervalued opportunity—Walk Score 49 and Transit Score 40 with MAX Orange Line access at a $549k median price. The city’s downtown revitalization along Main Street brings new restaurants and retail while maintaining small-town character.
Wilsonville delivers West Linn-Wilsonville’s excellent schools (95.8% graduation rate) with more moderate pricing ($637k). The Villebois master-planned community integrates parks, trails, and neighborhood commercial spaces, creating walkable pockets within a suburban setting.
Tigard balances strong schools (93.9% graduation rate) with Bridgeport Village shopping, Fanno Creek Trail recreation, and urban renewal projects transforming the Tigard Triangle into mixed-use development. At $600k median pricing, it offers premium amenities without Lake Oswego’s price tag.
Which City Fits Your Life? 4 Buyer Profiles Matched to Metro Neighborhoods
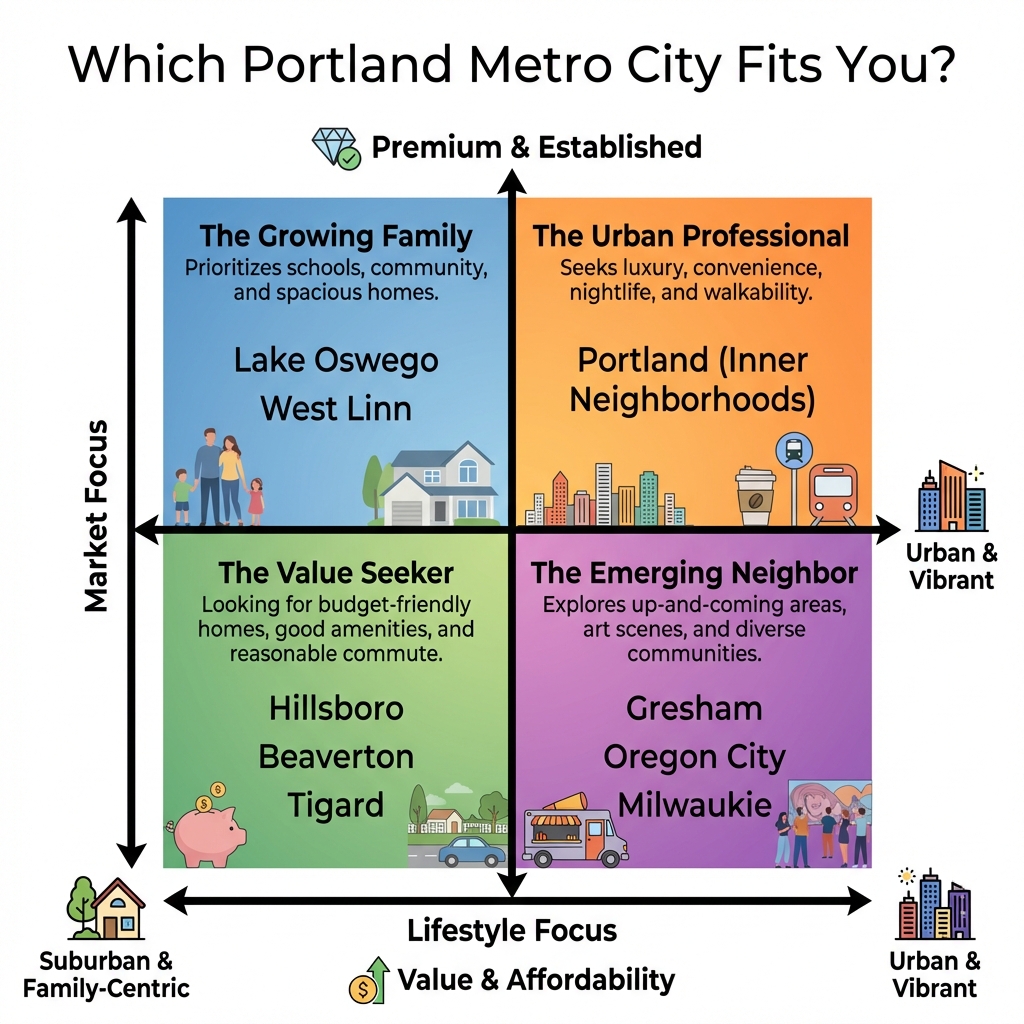
The matrix becomes actionable when applied to real-world buyer scenarios. By weighting priorities according to your life stage and preferences, 2-3 clear frontrunners typically emerge.
Scenario A: The Urban-Centric Professional
Priorities: High walkability, short commute to Portland, vibrant lifestyle. Schools and yard size aren’t concerns. Willing to trade space for location.
Top Picks:
- Portland (inner neighborhoods): Pearl District, Slabtown, and Hawthorne offer Walk Scores above 75 with Transit Scores reaching 60+. Every daily need—groceries, coffee, dining, entertainment—sits within walking distance. Condos and townhomes provide low-maintenance urban living.
- Milwaukie: The MAX Orange Line delivers 20-minute commutes to downtown Portland. Main Street’s revitalization brings breweries, restaurants, and shops within a 10-minute walk of the MAX station. Median price of $549k provides better value than comparable Portland walkability.
- Downtown Beaverton: The area around Beaverton Central MAX station is transforming into a walkable urban core. New mixed-use buildings offer modern construction with ground-floor retail, second-floor dining, and residential above—all within steps of light rail.
Scenario B: The Growing Family
Priorities: Top-tier schools, outdoor recreation, safe neighborhoods, space. Willing to accept longer commutes and car dependency for family-friendly environment.
Top Picks:
- Lake Oswego: The district’s 96.1% graduation rate leads the metro. Tryon Creek State Park provides 645 acres of trails within city limits. The community’s established character, low crime rates, and strong property values justify the $950k investment for families prioritizing education.
- West Linn: Similar school performance (95.8% graduation rate) with more varied housing stock, including larger lots and newer construction in areas like Bolton. Willamette River access and Mary S. Young Park offer extensive recreation without Lake Oswego’s price premium.
- Beaverton: The district’s 92.2% graduation rate combines with THPRD’s 200+ parks and 70 miles of trails. At $571k median pricing, families access excellent schools and recreation at significantly lower cost than Lake Oswego, though with trade-offs in community prestige and established neighborhoods.
- Tigard: The Tigard-Tualatin school district (93.9% graduation rate) rivals Lake Oswego’s performance at $600k median pricing. Cook Park, Fanno Creek Trail, and community programming create a family-centric culture.
Scenario C: The Budget-Conscious First-Time Buyer
Priorities: Housing cost is paramount. Seeking long-term value and growth potential. Willing to compromise on immediate amenities for future appreciation.
Top Picks:
- Gresham: The $500k median represents the metro’s most accessible entry point. Proximity to MAX Blue/Green Lines maintains Portland job access. Columbia River Gorge recreation sits 20 minutes east. The city’s ongoing investment in downtown improvements and the Springwater Corridor Trail signals commitment to livability improvements that could drive appreciation.
- Oregon City: At $565k, Oregon City offers historic charm and the Willamette Falls Legacy Project—a transformational riverfront development that could catalyze downtown revitalization. The project’s completion creates significant upside potential for early buyers.
- Hillsboro: The $555k median pricing masks the city’s robust economic fundamentals. Intel’s continued expansion and the South Hillsboro development represent long-term growth drivers. Tech sector job growth creates consistent housing demand, historically producing steady appreciation.
Scenario D: The Downsizer/Empty-Nester
Priorities: Single-level living, low maintenance, walkability to services, healthcare access. Schools irrelevant. Seeking community and convenience.
Top Picks:
- Lake Oswego: Condos and townhomes near the town center provide elevator access, minimal yard maintenance, and walking distance to medical offices, dining, and shopping. The community’s established nature means nearby friends and social networks for long-time residents.
- Tigard/Tualatin: Numerous 55+ communities and patio home developments cater specifically to downsizers. Single-level floor plans, HOA-managed exteriors, and proximity to Meridian Park Hospital meet practical needs. Community centers offer classes and social programming.
- Wilsonville’s Villebois: This master-planned community’s newer construction includes accessible single-level homes with open floor plans. Integrated parks, a community center, and neighborhood-scale retail create a walkable environment. The planned community model provides built-in social structure through events and activities.
Why Data Alone Won’t Find You the Perfect Home

The decision matrix is a powerful analytical tool, but it captures only part of what makes a house feel like home. Data tells you where to look—experience tells you what to look for.
Visit in Person at Different Times
A neighborhood’s character changes throughout the day. Visit on weekday mornings to gauge commute traffic. Return on weekend evenings to experience the dinner crowd at local restaurants. Walk the streets after dark to assess lighting and perceived safety. Saturday mornings at the farmers market reveal community culture better than any statistic.
Talk to residents: Knock on doors. Ask about noise from nearby highways or flight paths that don’t show up in data. Learn about HOA dynamics—are they reasonable or overly restrictive? Discover the neighborhood’s quirks: Where does everyone walk their dogs? Which streets get snow plowed first? Is street parking a battle? Current residents share insights no database captures.
Tour schools in person: Test scores reveal academic performance, but campus visits expose school culture. Meet with principals. Observe hallway interactions between students. Ask about class sizes, extracurricular offerings, and parent involvement. A school with a 90% graduation rate but burnt-out teachers differs significantly from one with the same rate but vibrant community engagement.
Consider life’s trajectory: Your needs five or ten years from now may differ from today. Can aging parents visit if stairs are required? Will the neighborhood support teenagers’ independence, or will you become a constant chauffeur? Does the community offer lifelong appeal, or will you outgrow it as priorities shift?
Leverage agent expertise: An experienced local agent layers hyper-local market knowledge onto the data framework. They know which neighborhoods are appreciating fastest, which have hidden supply constraints driving competition, and which sellers are motivated. They identify the difference between a home listed at $600k that will sell for $620k and one likely to sell below ask due to condition issues. This expertise transforms the matrix from interesting analysis to actionable strategy.
Data is your compass, pointing you toward promising directions. Experience and expertise provide the map’s detail—revealing shortcuts, highlighting obstacles, and ultimately guiding you to the destination that fits your unique circumstances.
Key Takeaways
Choosing where to live in the Portland metro is more than selecting a house—it’s investing in a lifestyle, community, and financial future. In a region as diverse as Portland, where Lake Oswego’s premium schools contrast sharply with Hillsboro’s tech-driven growth and Gresham’s affordability, a one-size-fits-all approach simply doesn’t work.
The 7-pillar decision framework presented here transforms the overwhelming array of choices into a structured, actionable process. By systematically evaluating housing costs, school quality, walkability, transit access, recreation, taxes, and development trajectories, you can identify the 2-3 communities that truly align with your priorities.
But remember: data is your compass, not your destination. The Walk Scores, graduation rates, and tax figures provide the foundation—but the final decision requires boots-on-the-ground exploration, conversations with locals, and expert guidance from an agent who knows the market’s nuances.
Ready to Move Beyond Guesswork?
Use this framework as your starting point, and partner with a professional who can help you find not just a house, but the right home in the right place.
References:
- Portland State University Population Research Center – 2020 Census Counts
- Metro – Urban Growth Boundary
- Oregon Employment Department – Portland Area Economic Information
- National Association of Realtors – 2022 Profile of Home Buyers and Sellers
- Portland Business Journal – Portland Housing Market Data May 2024
- Oregon Department of Education – Cohort Graduation Rate Data
- Walk Score – Methodology
- U.S. Census Bureau – American Community Survey
- Metro – Parks, Trails and Natural Areas
- Oregon Department of Revenue – Property Tax
- Portland State University – Oregon Population Forecast Program
- Multnomah County – Tax Rate Information
- Washington County – Tax Rates and Levies
- Clackamas County Assessor – Tax Reports
- U.S. Census Bureau – 2020 Decennial Census
- Willamette Falls Legacy Project
- City of Hillsboro – South Hillsboro
- Intel Corporation – Intel in Oregon
- U.S. Census Bureau – American Community Survey 5-Year Estimates
- TriMet – MAX Light Rail
- Tualatin Hills Park & Recreation District – About Us
- City of Beaverton – Downtown Redevelopment
- City of Portland – Residential Infill Project
- City of Wilsonville – Villebois